grafana+prometheus实现云主机监控
配置 Prometheus
1 | mkdir prometheus |
- 编写 prometheus 配置文件
1 | global: |
- 启动 prometheus
1 | docker run -p 9090:9090 -d --rm --name prometheus -v /root/app/prometheus/:/etc/prometheus/ prom/prometheus |
配置 Node Exporter 采集服务器数据
- 启动 node exporter
1 | docker run -d --name node-exporter -p 9100:9100 -v "/root/app/prometheus/proc:/host/proc:ro" -v "/root/app/prometheus/sys:/host/sys:ro" -v "/root/app/prometheus:/rootfs:ro" prom/node-exporter |
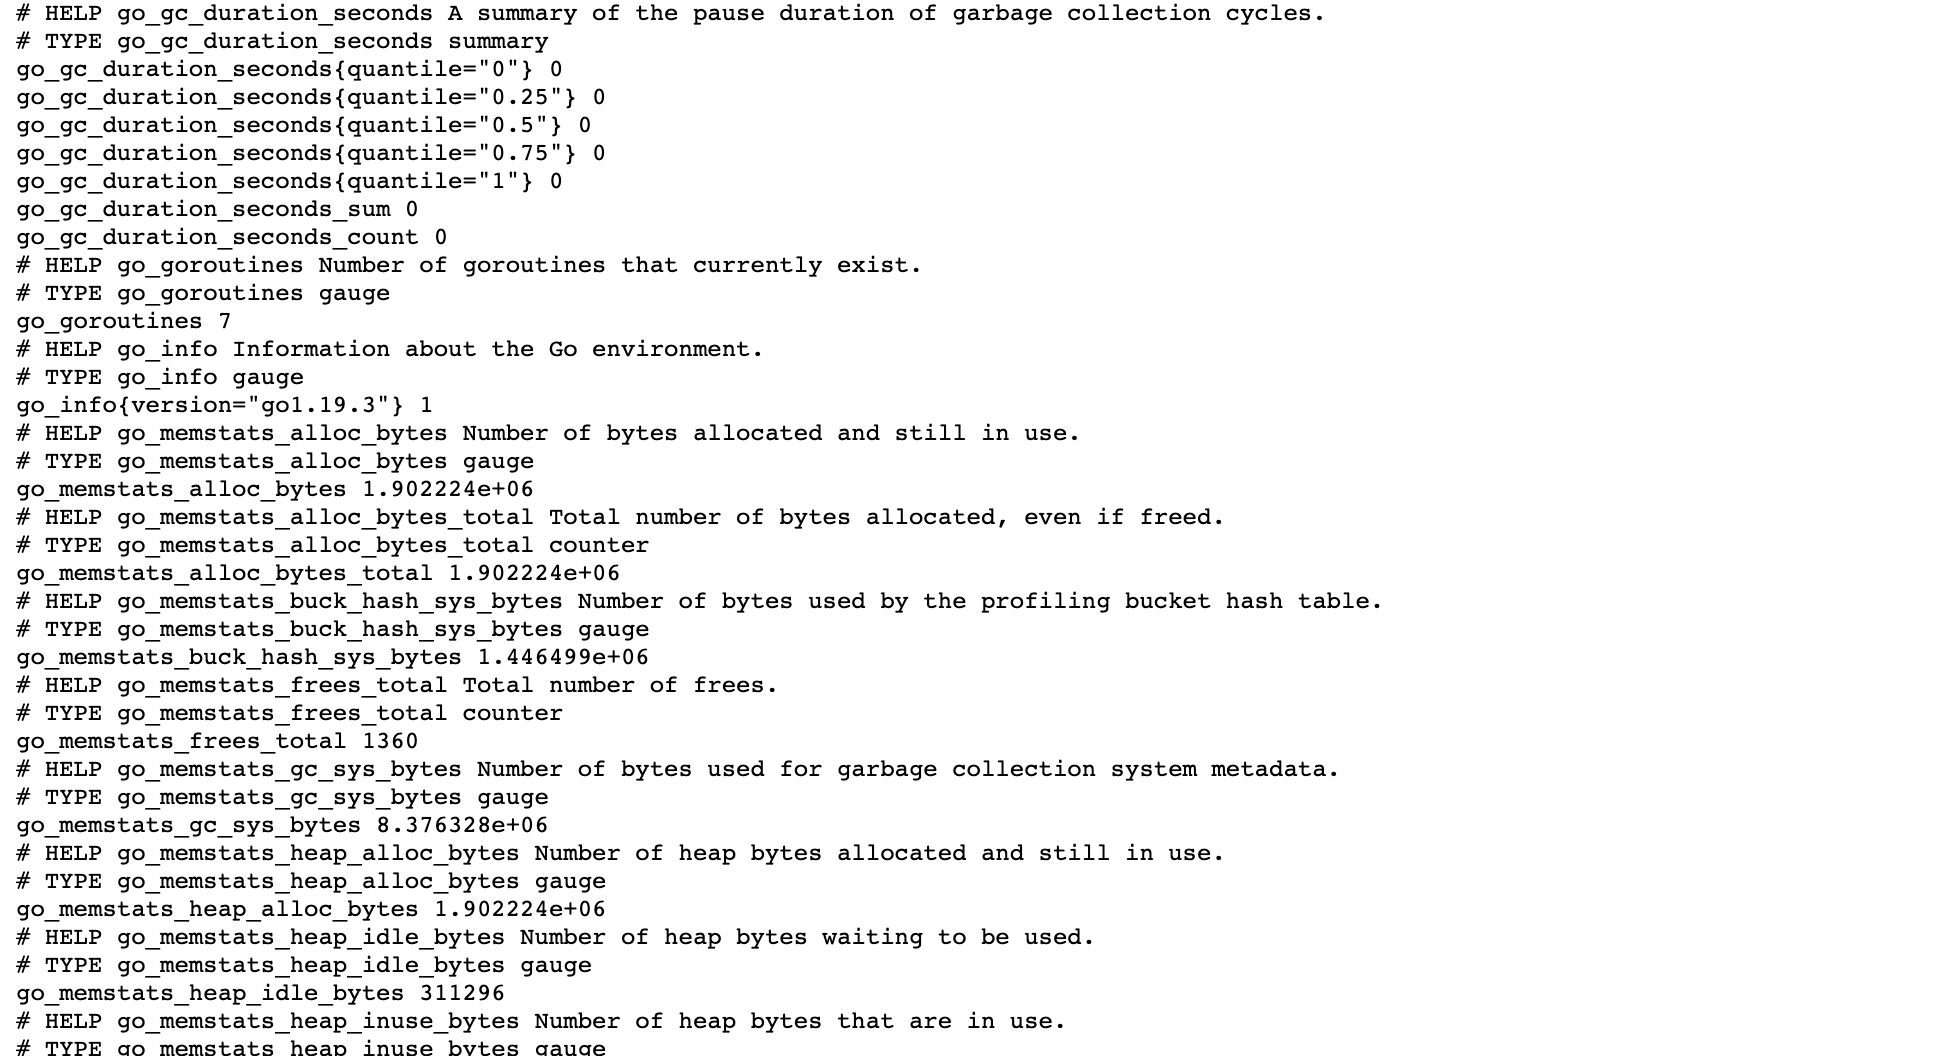
- 查看 node exporter
浏览器打开 http://<你的服务器 ip>:9100/metrics
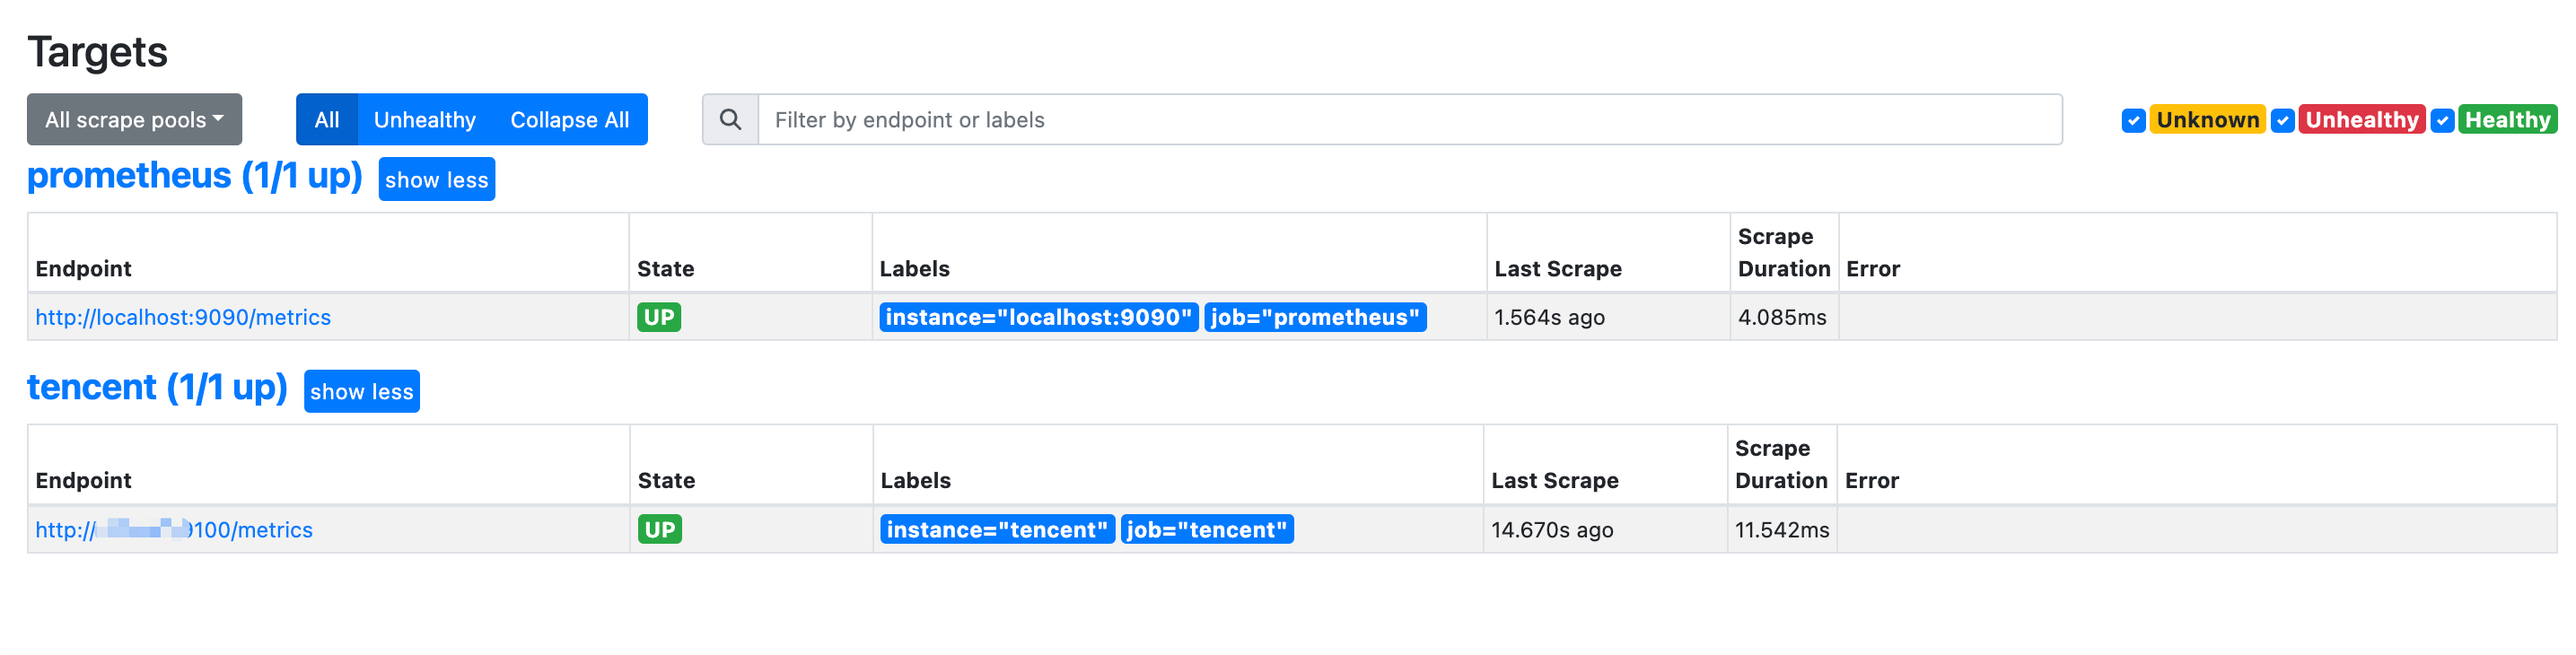
- 查看数据源
浏览器打开 http://<服务器 ip>:9090
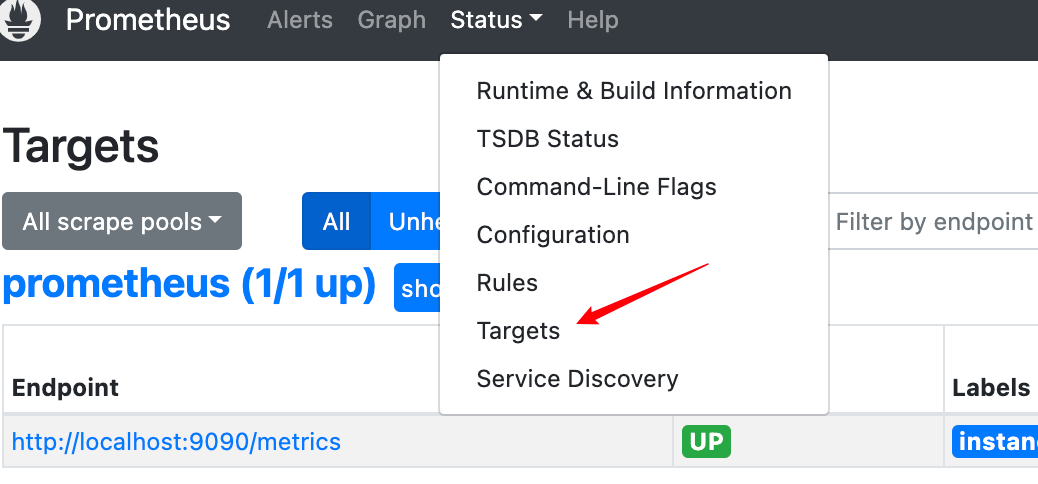
点击后就能看到你配置的数据源了
配置 Grafana
- 启动 grafana
1 | docker run --rm --name grafana -p 30001:3000 -d grafana/grafana |
- 配置数据源
打开 http://<服务器 ip>:3001
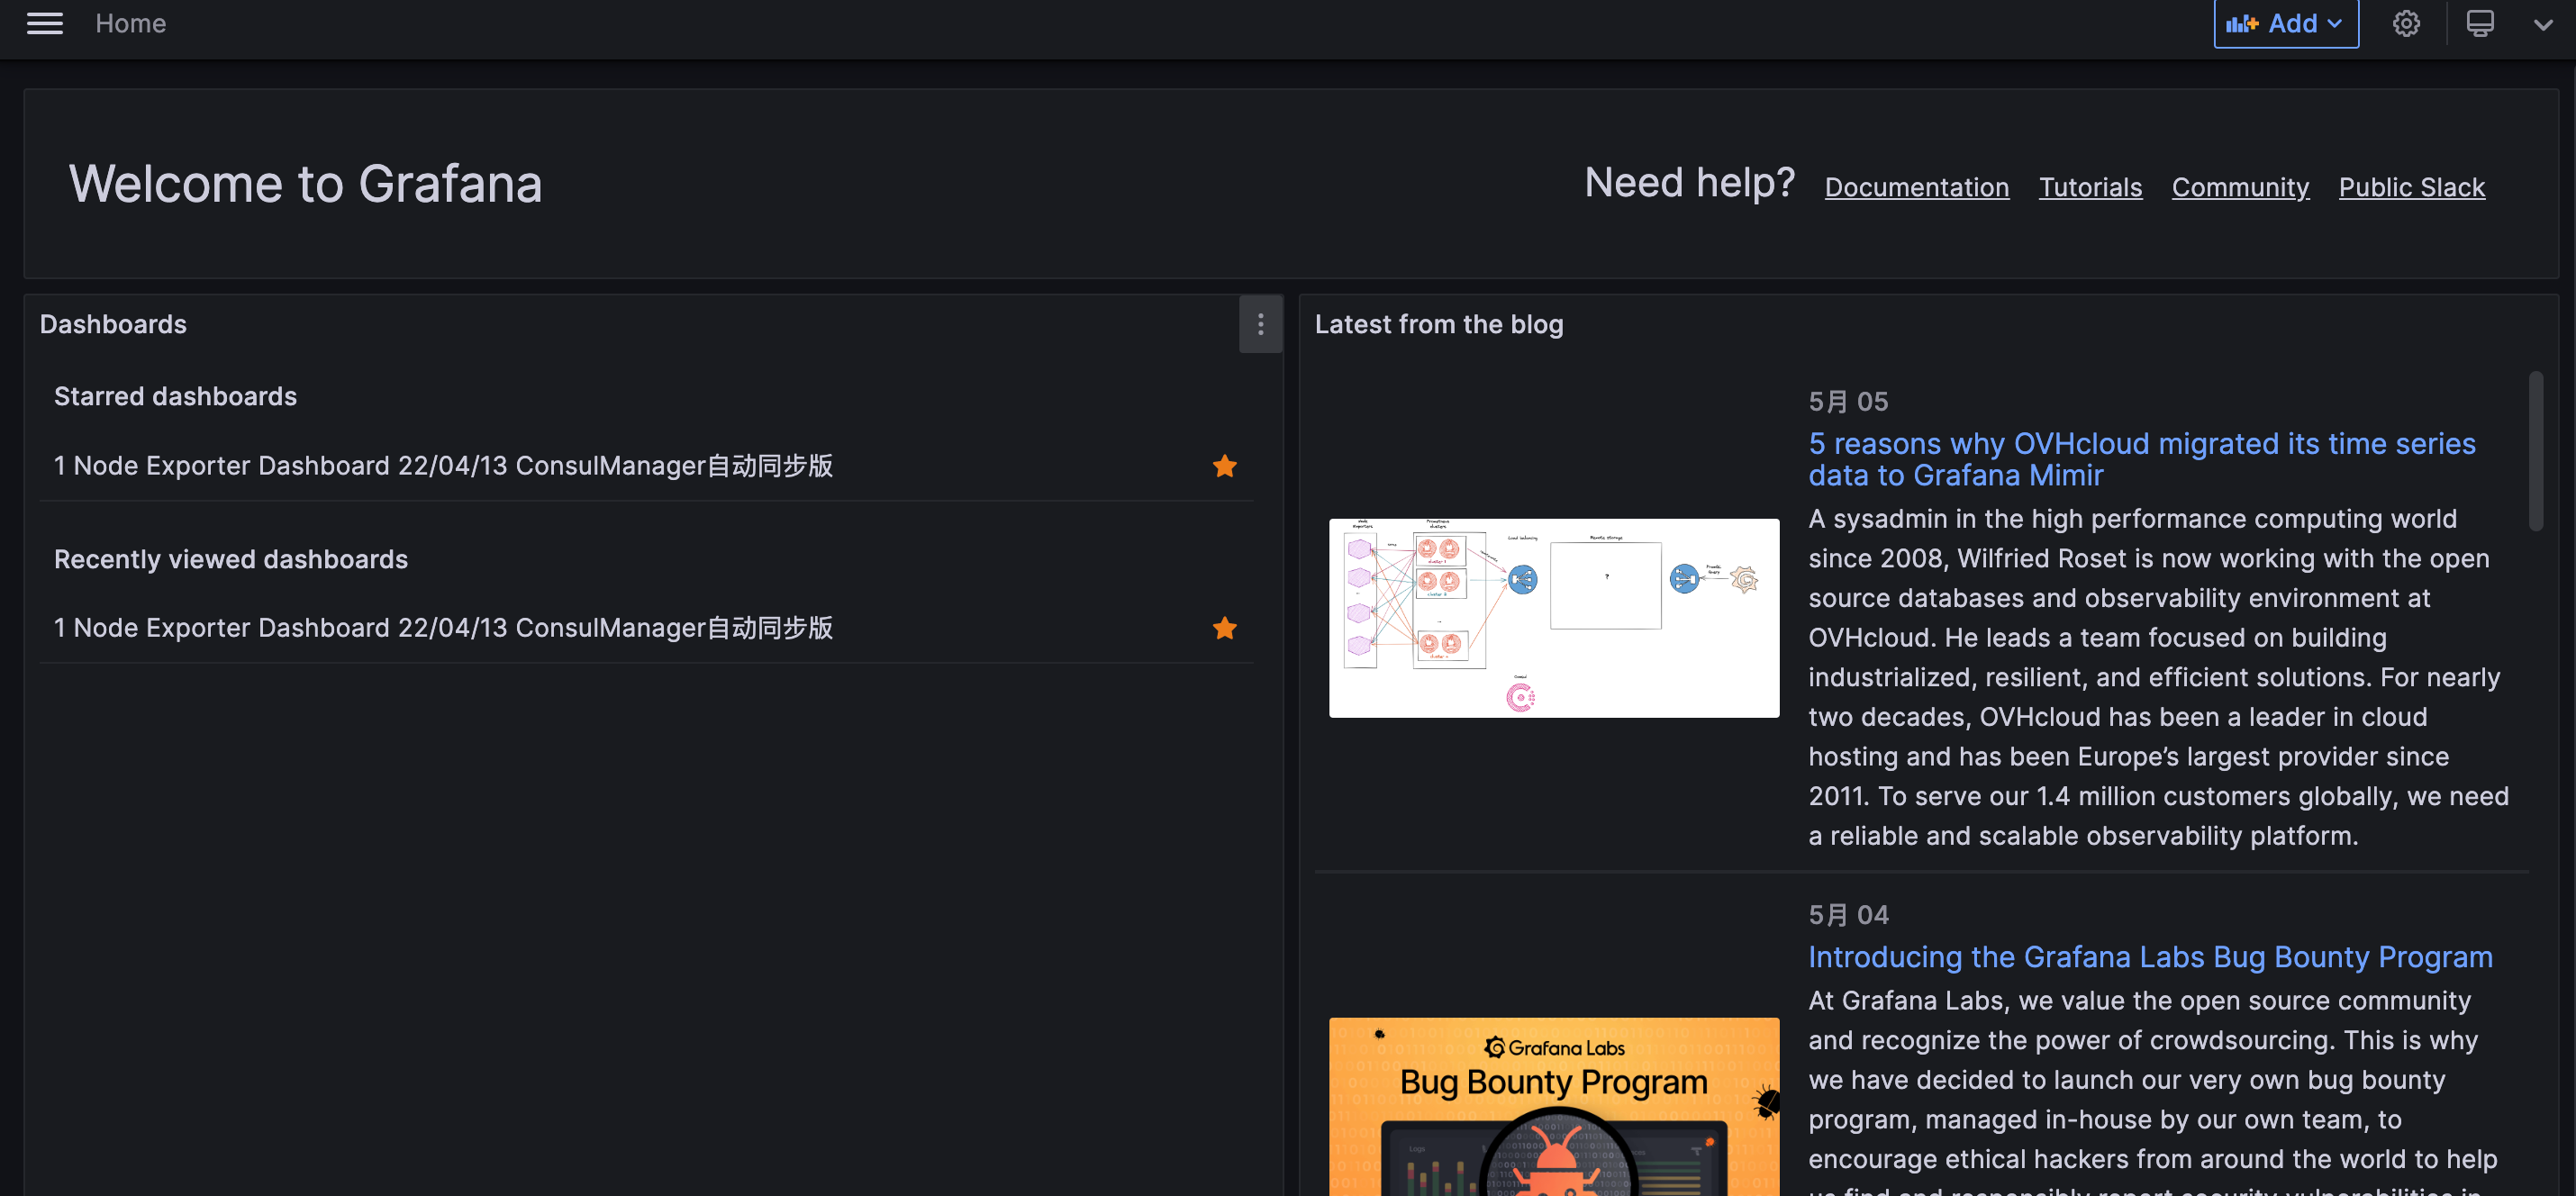
配置数据源

勾选 prometheus
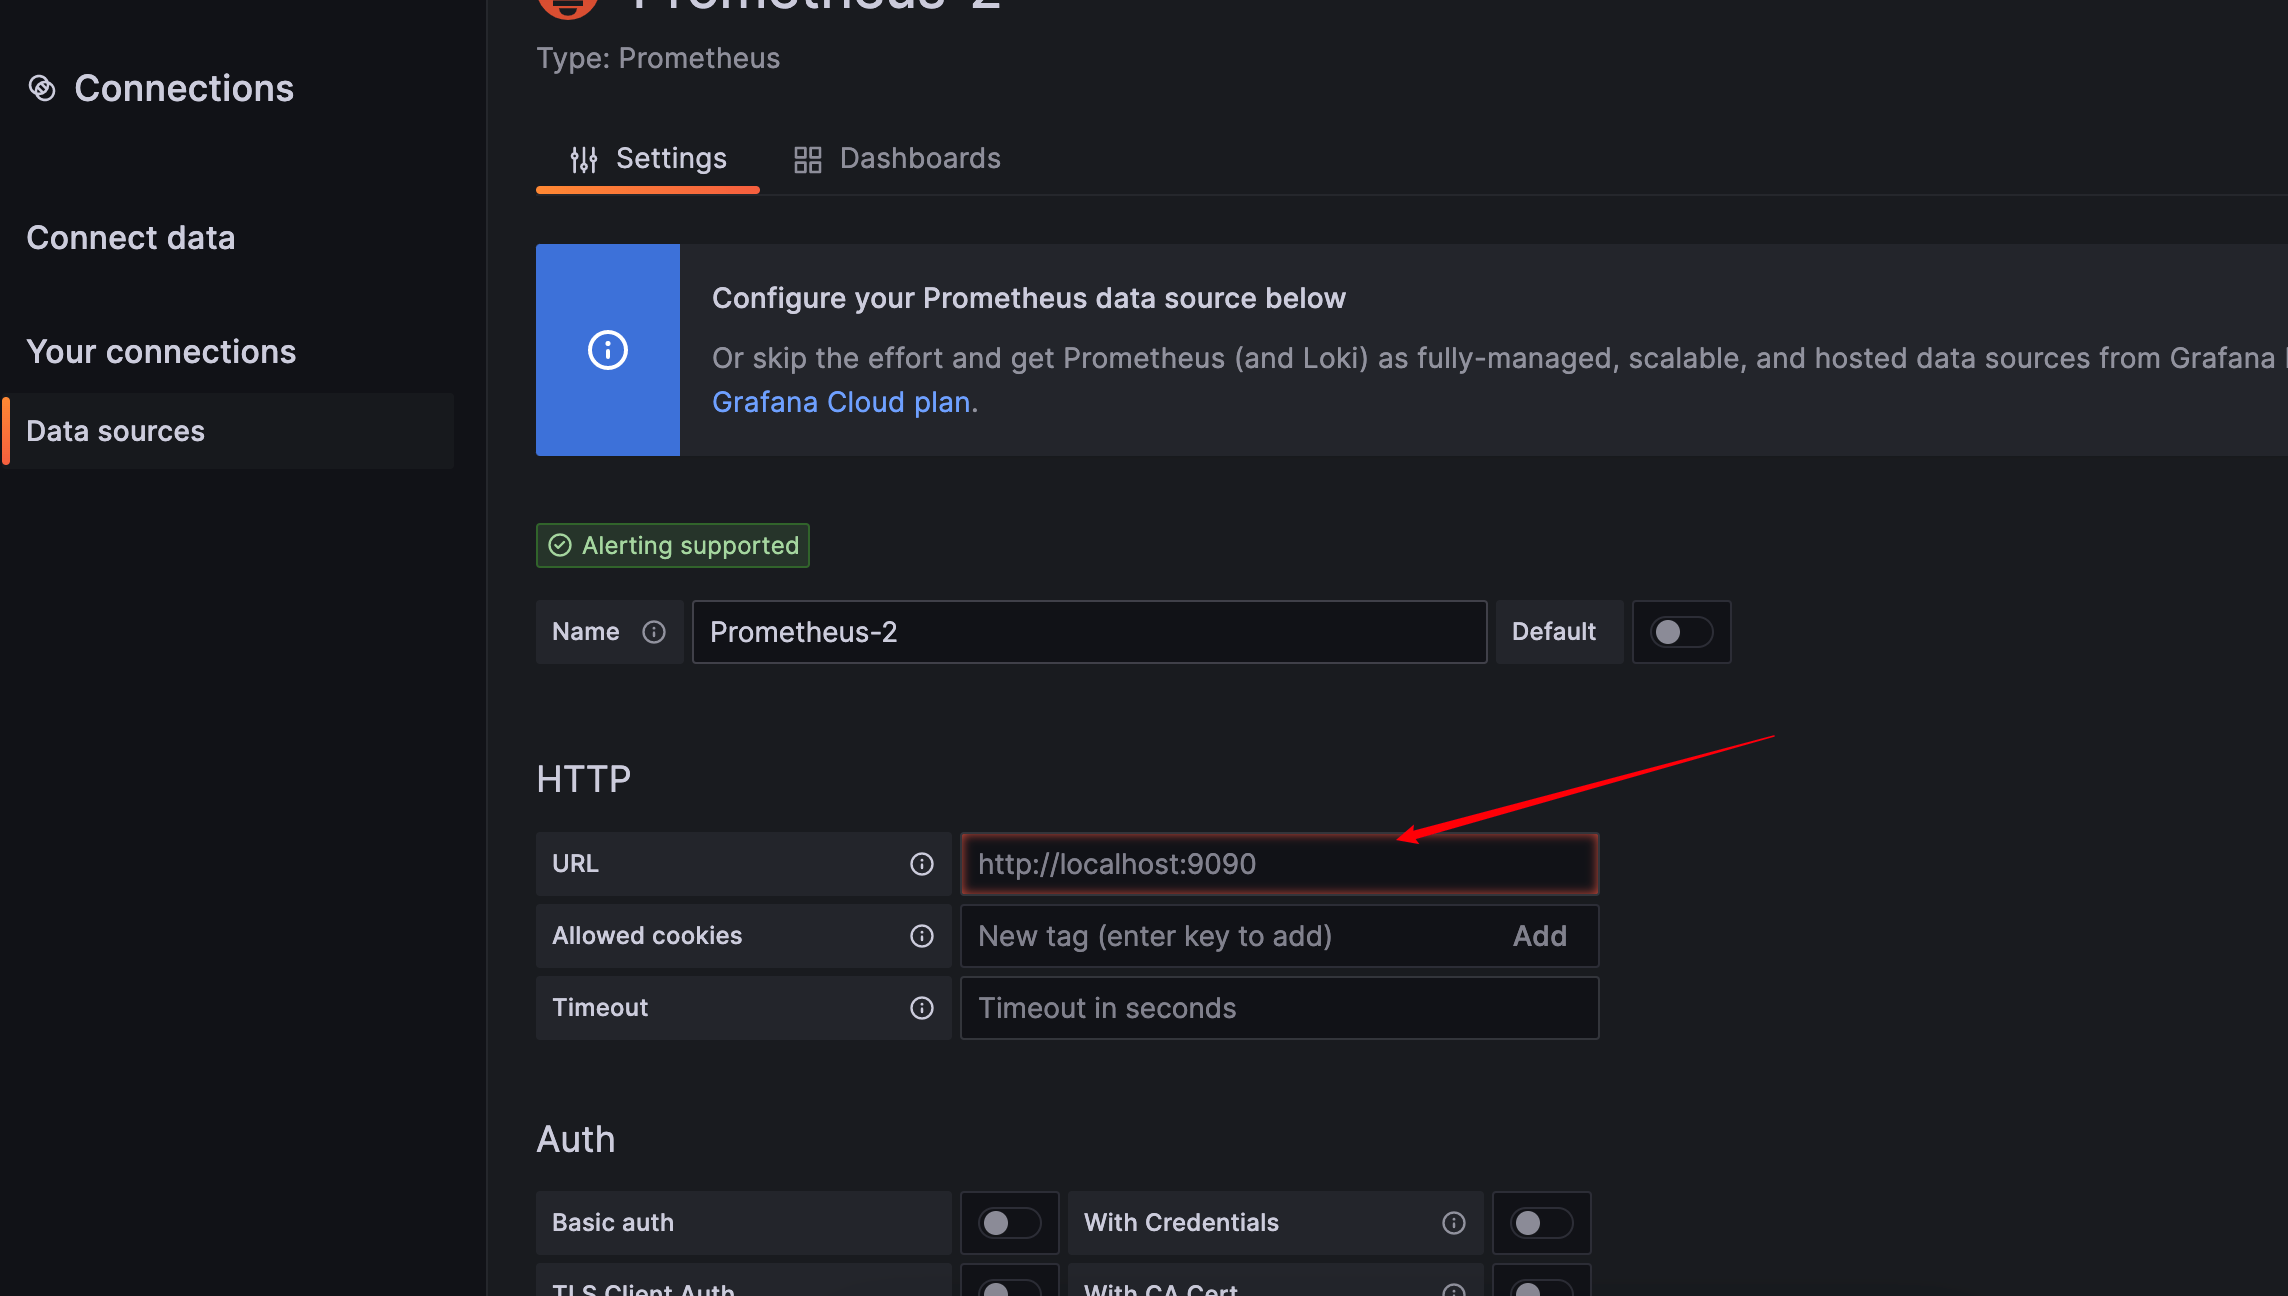
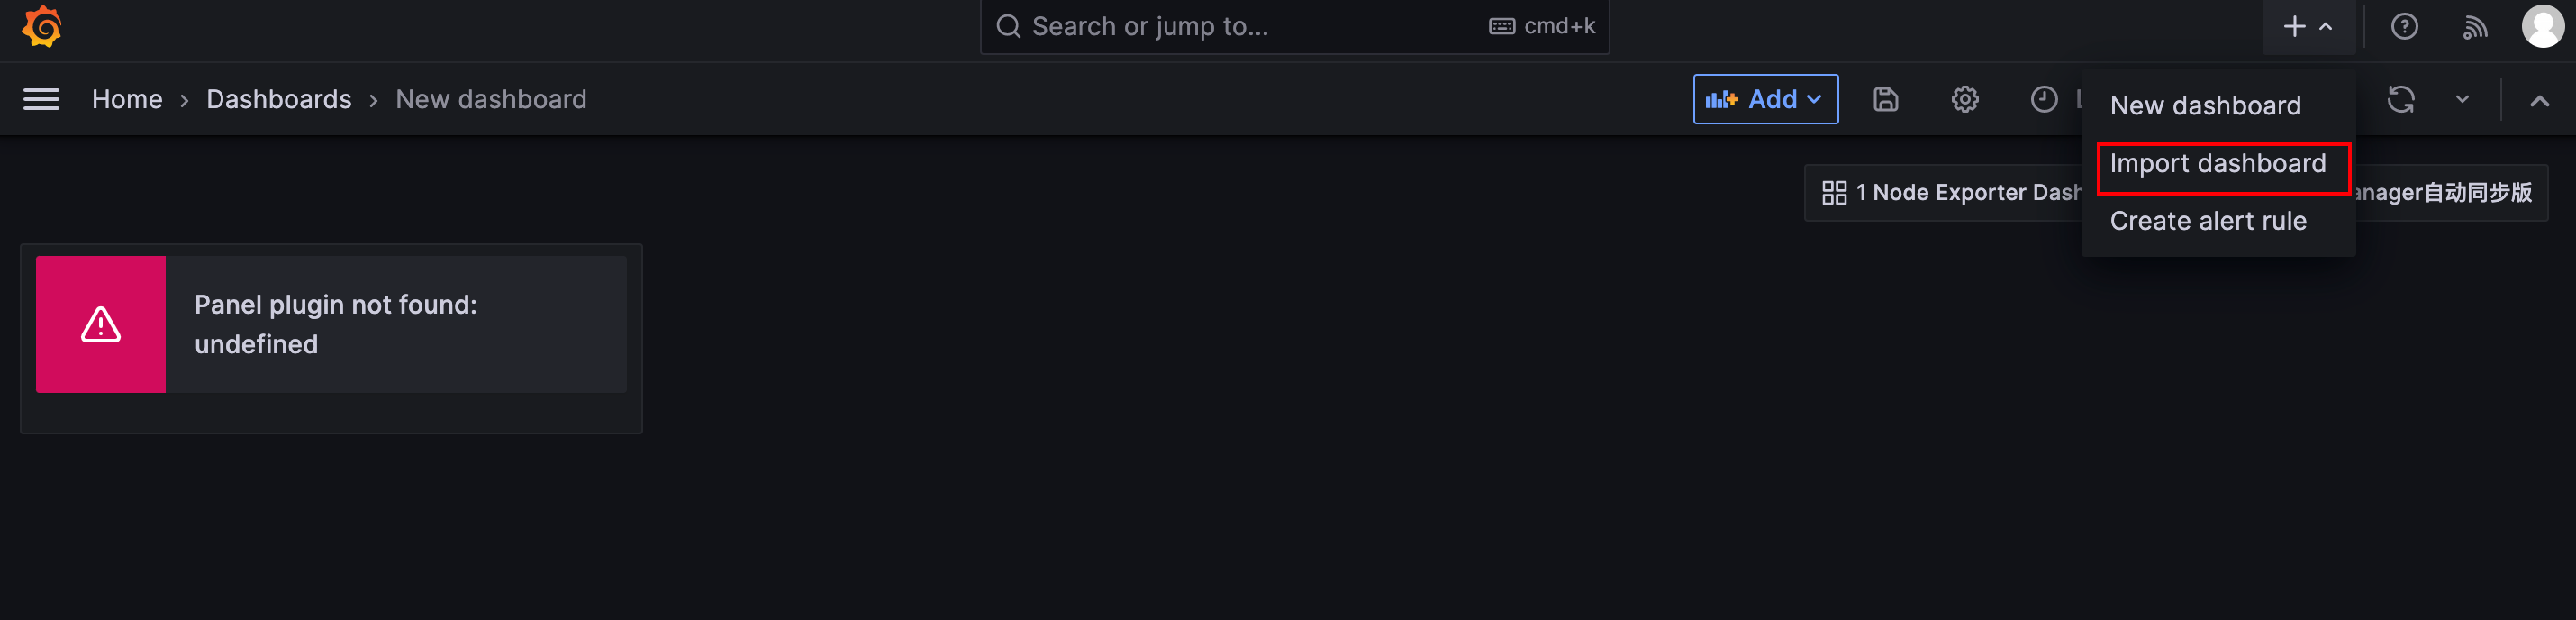
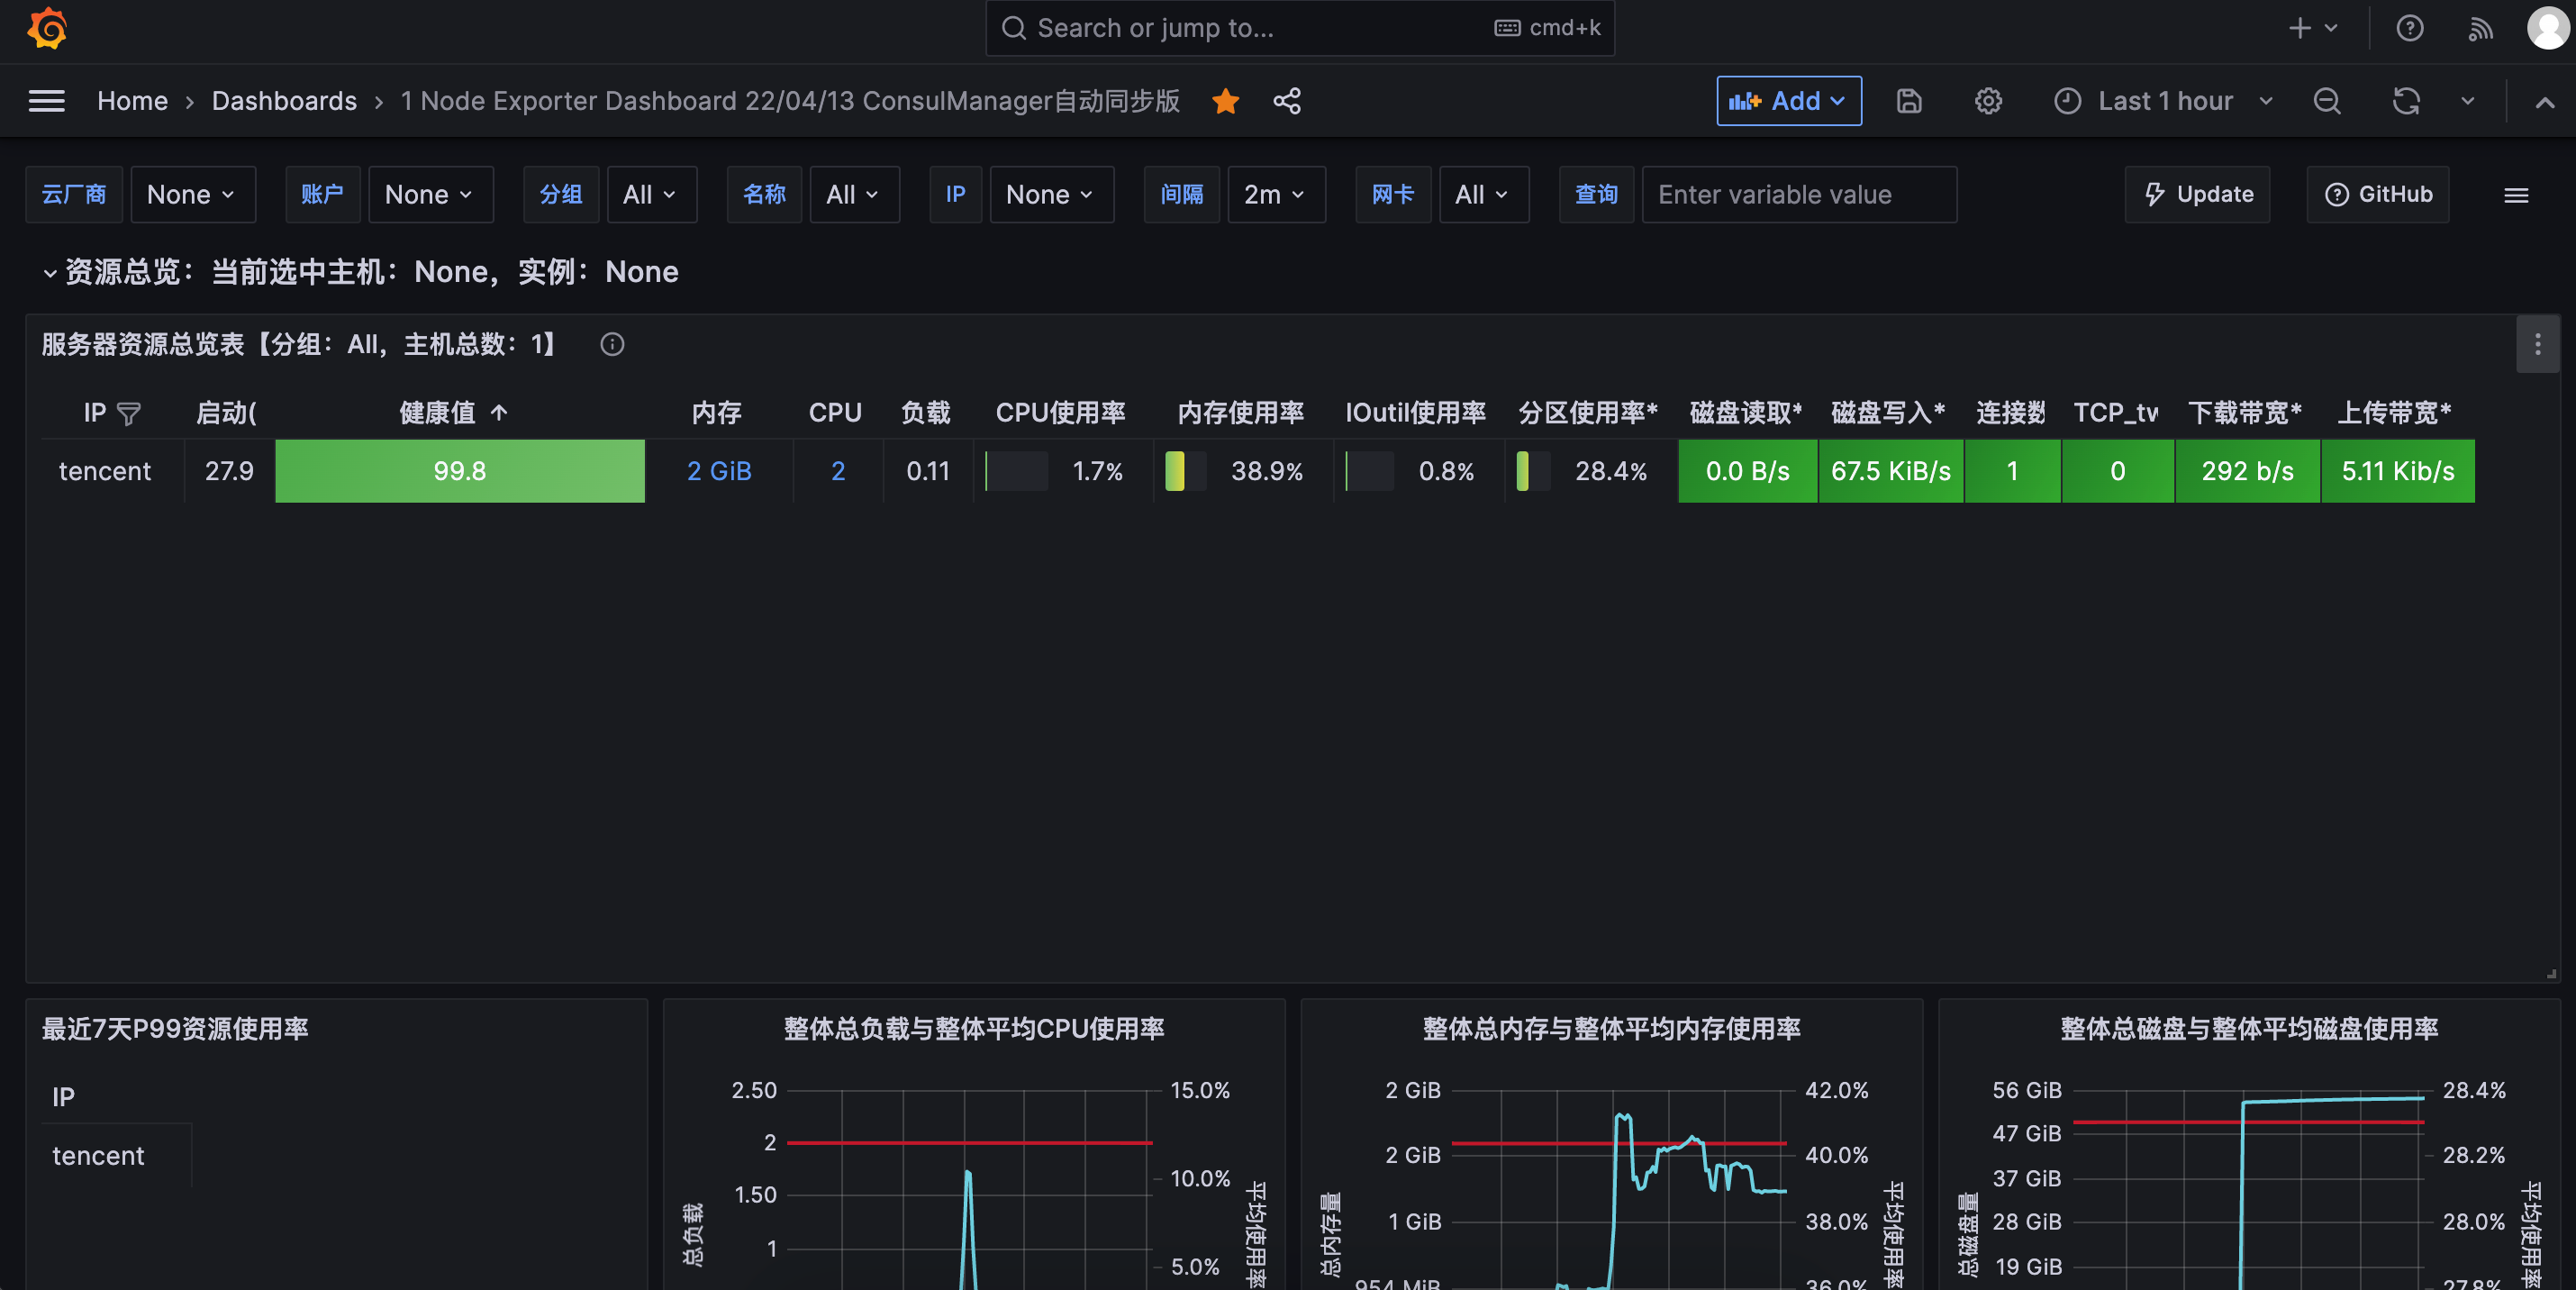
然后再将刚刚的 prometheus 网址输入进去然后点击 Save & test 然后在导入一个别人已经布置好的 dashboard https://grafana.com/grafana/dashboards/8919 输入编号 8919
然后就大功告成啦!
注:grafana 首次登入的账号密码是 admin 进去后会修改密码
grafana+prometheus实现云主机监控